CEMI’s initial research portfolio will include studies of: environmental links to cancer; health disparities in morbidity and mortality; and links between environmental stressors and cardiovascular disease risk. Discovery Challenge funding will allow expansion in these and other areas, thus addressing some of the most perplexing problems at the intersection of environmental exposure and human health. More specifically our projects include:
Current Projects
Hazardous Air Pollutant Exposure as a Contributing Factor to COVID-19 in the United States
Background
To date, COVID-19 has claimed tens of thousands of American lives. Early inquiry suggests preexisting conditions are key risk factors contributing to COVID-19 mortality and air pollution exposure could exacerbate this relationship. Building on prior research linking deaths from respiratory viruses to air pollution exposures, we investigate how 2014 National Air Toxics Assessment (NATA) Hazardous Air Pollutants (HAPs) respiratory hazard quotient (HQ) and respiratory hazard index (HI) are related to COVID-19 mortality.
Objectives
We aim to examine the relationship between HAP exposure and US-based COVID-19 mortality while controlling for socioeconomic status, population health indicators, and exposure to PM2.5 and ozone.
Methods
We fit county-level zero-inflated negative binomial mixed models to predict COVID-19 mortality as a function of HAP respiratory toxicity levels while controlling for relevant demographic, chronic disease risk, and other factors. We fit models for combined exposure to HAPs as well as for specific pollutants. The NATA respiratory hazard quotient (HQ) is the ratio of a substance concentration and the level at which no adverse effects are expected. The respiratory hazard index (HI) is the sum of each hazard quotient (HQ); an HI value of less than 1 is expected to cause no human health effects.
Results
An increase of 0.1 in the hazard index (HI) is associated with a 15 percent increase in COVID-19 mortality, when controlling for other risk factors. Although differing in magnitude, this association holds for individual HAPs, acrolein, and diesel PM.
Discussion
Our findings contribute to how we understand variation in US-based COVID-19 mortality rates. In addition, we provide additional support for existing research that links air pollution to mortality. These findings emphasize the importance of continued regulatory efforts to limit air pollution exposure risk and of better understanding the health impacts from combined HAP exposure.
595 Chemicals Upstream:
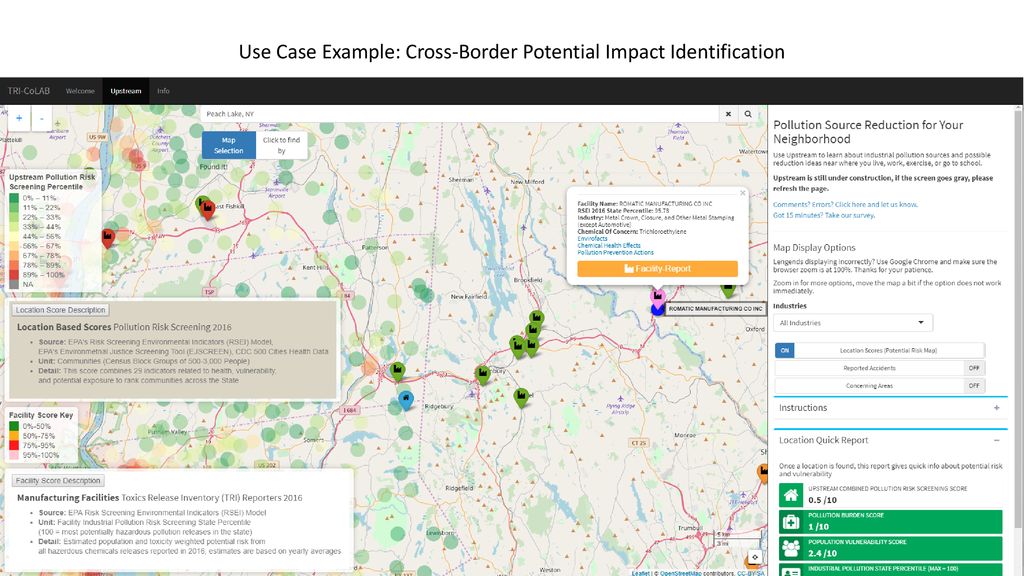
HOw polluted is your neighborhood?
This project employes big data and coding to answer key questions on pollution. It combines data from:
Toxic Release Inventory (TRI): This dataset goes back to 1987 containing over 595 chemicals that are stored, manufactured, released, or otherwise used by facilities. Some example chemicals include mercury, Trichloroethylene, and lead. This dataset also includes information on P2 actions that facilities undertake which reduce releases of the chemicals into the air, water, or soil (EPA 2018c).
Risk Screening Indicators Model (RSEI): This model derives estimated impact scores from TRI releases by applying toxicity and population weights to each chemical release by media (Air, Water and Incineration) so that those releases with the greatest potential risk receive higher scores (EPA 2018b).
National Response Center (NRC): This is a 24 hour continuously manned Coast Gaud call center charged to receive chemical and other substance spill reports and respond to emergencies.
Our algorithm, National Match, identifies a business’s TRI match group with 6 commonalities:
Chemicals reported
Use of chemicals
Amount of chemicals released
Amount stored on-site
Waste management methods
First reporting year (age proxy)
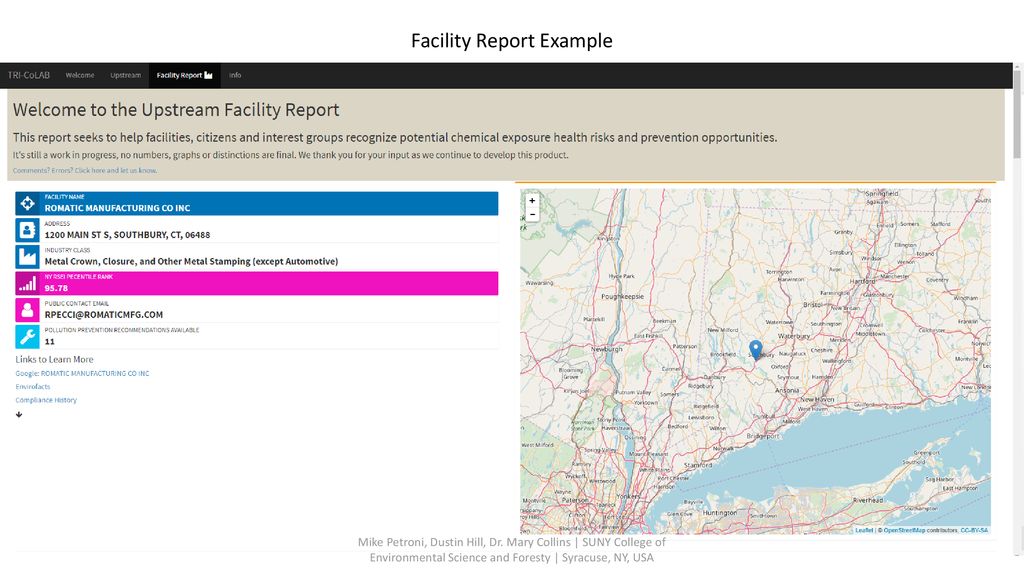
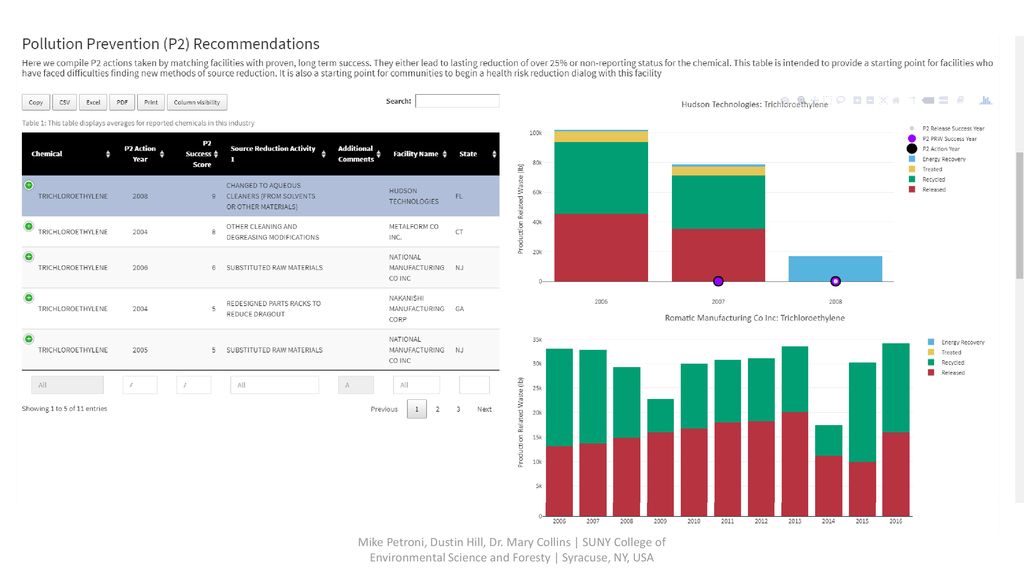
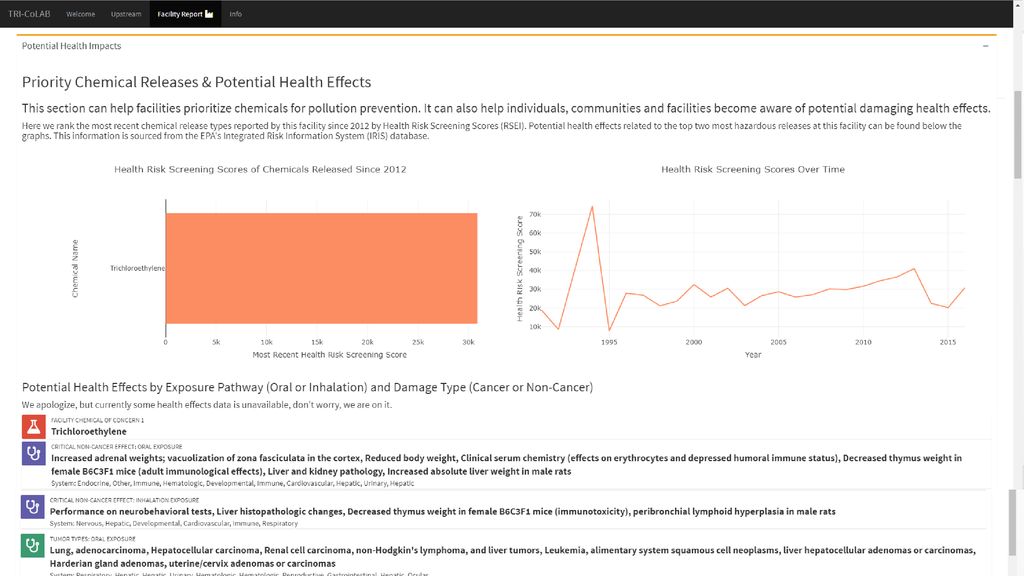
This method allows for in-depth comparisons and targeted recommendation of P2 actions. It’s difficult to determine the ‘real’ impact of P2 actions due to year to year changes in production at facilities. Normalizing releases by production ratios, we found 10-15% achieve sustained reductions and 5-8% of reports contain optional, additional information. If a match implemented one of these, we share it.Risk perception can be difficult, especially with complex risks like long term chemical exposure. Often individuals rely on trusted entities (like the EPA) to mitigate this risk, or develop apathy, as consequences seem uncertain and actions difficult to undertake. We organize RSEI scores to prioritize concern and action, empowering user decision making by identifying facilities and chemicals of concern with health risks at their home, school, work, and recreation areas. Include potential P2 solutions, facility contact information, and other risk reduction options. We build the map interface using R, a free, open source statistical coding language and some HTML. Upstream utilizes popular R packages including Google address searching, Leaflet maps, R-Shiny, and Shiny Dashboard.
Toxic Release Inventory (TRI): This dataset goes back to 1987 containing over 595 chemicals that are stored, manufactured, released, or otherwise used by facilities. Some example chemicals include mercury, Trichloroethylene, and lead. This dataset also includes information on P2 actions that facilities undertake which reduce releases of the chemicals into the air, water, or soil (EPA 2018c).
Risk Screening Indicators Model (RSEI): This model derives estimated impact scores from TRI releases by applying toxicity and population weights to each chemical release by media (Air, Water and Incineration) so that those releases with the greatest potential risk receive higher scores (EPA 2018b).
National Response Center (NRC): This is a 24 hour continuously manned Coast Gaud call center charged to receive chemical and other substance spill reports and respond to emergencies.
Our algorithm, National Match, identifies a business’s TRI match group with 6 commonalities:
Chemicals reported
Use of chemicals
Amount of chemicals released
Amount stored on-site
Waste management methods
First reporting year (age proxy)
This method allows for in-depth comparisons and targeted recommendation of P2 actions. It’s difficult to determine the ‘real’ impact of P2 actions due to year to year changes in production at facilities. Normalizing releases by production ratios, we found 10-15% achieve sustained reductions and 5-8% of reports contain optional, additional information. If a match implemented one of these, we share it.Risk perception can be difficult, especially with complex risks like long term chemical exposure. Often individuals rely on trusted entities (like the EPA) to mitigate this risk, or develop apathy, as consequences seem uncertain and actions difficult to undertake. We organize RSEI scores to prioritize concern and action, empowering user decision making by identifying facilities and chemicals of concern with health risks at their home, school, work, and recreation areas. Include potential P2 solutions, facility contact information, and other risk reduction options. We build the map interface using R, a free, open source statistical coding language and some HTML. Upstream utilizes popular R packages including Google address searching, Leaflet maps, R-Shiny, and Shiny Dashboard.
|
|
Evaluation of Particulate Matter Air Pollution Distribution, Concentration, and Composition Near an Elevated Highway in Syracuse, NY
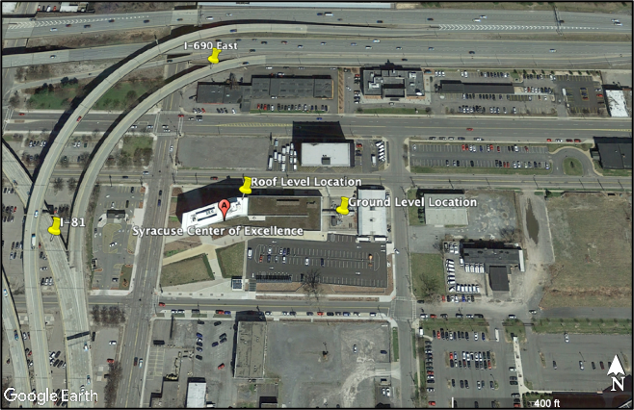
There are two major interstates that run through downtown Syracuse, NY: Interstates-81 and -90. Interstate-81, which is an elevated viaduct, goes right through the heart of the downtown area, with local businesses and homes residing below it. I-690, a bypass for I-90, is a major part of the current elevated viaduct system in Syracuse and is largely used by local traffic traveling from the suburbs of Syracuse into the city. The limit of safety for the elevated I-81/690 infrastructure is ending, and New York State is looking for recommendations to either rebuild the roadways using its current elevated design or lower the highway to ground level and create a community grid. People living in the low-income neighborhoods below the Interstate are concerned about an increase in air pollution and noise if the Interstate is lowered. Therefore, it is important to conduct an intensive air quality and noise campaign to measure air pollutants, especially particulate matter (PM), simultaneously at the highway and ground levels. Measuring PM at these two elevations will allow for comparison between where the traffic currently resides (highway level) and where the traffic will be relocated (ground level) if the community grid design is pursued. Models generated by the New York Department of Transportation (DOT) suggest that traffic levels will not change if the highway is lowered. This proposed study can offer a glimpse into potential air quality and noise problems that can arise if the community grid design is pursued.
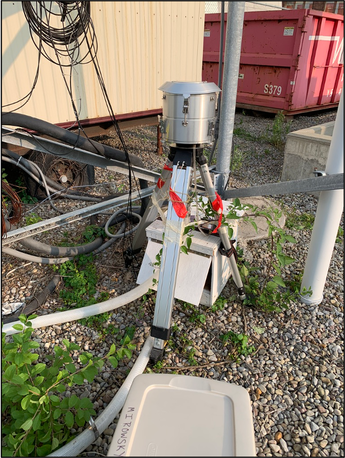
Impactor: A cascade impaction system is used to collect size-fractionated particulate matter. This system pulls air through its stages at 900 L/min, allowing for large amounts of PM to be collected in a short amount of time.
|
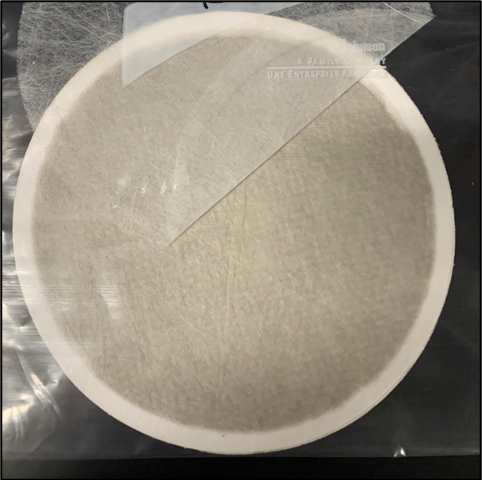
Filter: This filter is used to collect PM2.5 in the cascade impaction system. Shown here is a filter after air sampling for 24 hours at ground level in Syracuse, NY.
|

Air pollution from industrial toxics: A cross-sectional study of chronic Lead (Pb), Mercury (Hg), and Cadmium (Cd) exposure and intermediate cardiovascular health outcomes

|
Exposure to air pollution has been linked to health effects in individuals in occupational environments and in regions proximate to air pollution sources. Linking specific air pollutants to specific human biomarkers has been done with some success but is often based on occupational cohort data. Use of estimated chemical concentrations from the Risk Screening Environmental Indicators (RSEI) model derived from the Toxics Release Inventory (TRI) could help approximate individual lifetime exposure to potential risk from air pollution. This data has yet to be linked to biomarkers and has had limited application to chronic health effects of populations.
|
New Projects
New information on these projects coming soon!

|
COVID-19 Watewater Modeling as a Predictor of Outbreaks and a Tool for Future Pandemics
|

|
COVID-19 and Air Quality
|

|
New York Enviroscreen
|
Center for Environmental Medicine and INformatics
Updated May 2020
